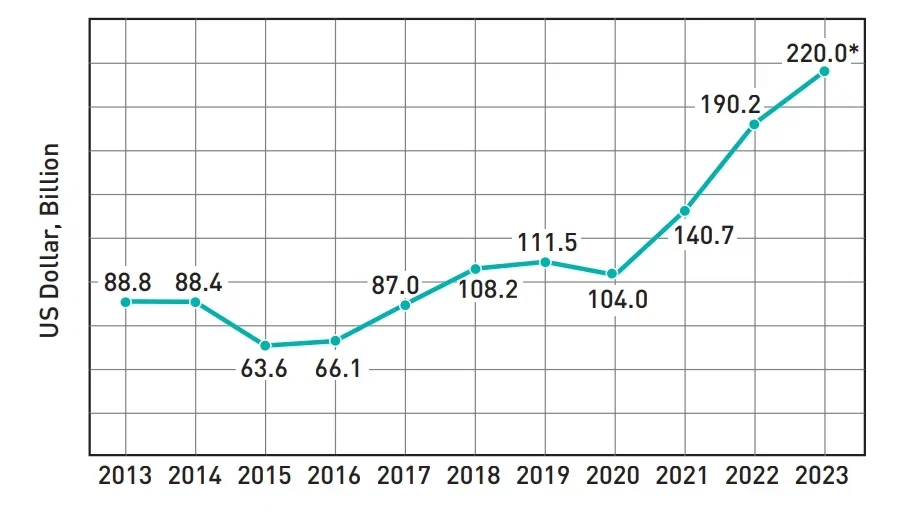
Figure 20. Trade between Russia and China (2013-2023).
Sources: Compiled by PIR Center based on open sources.
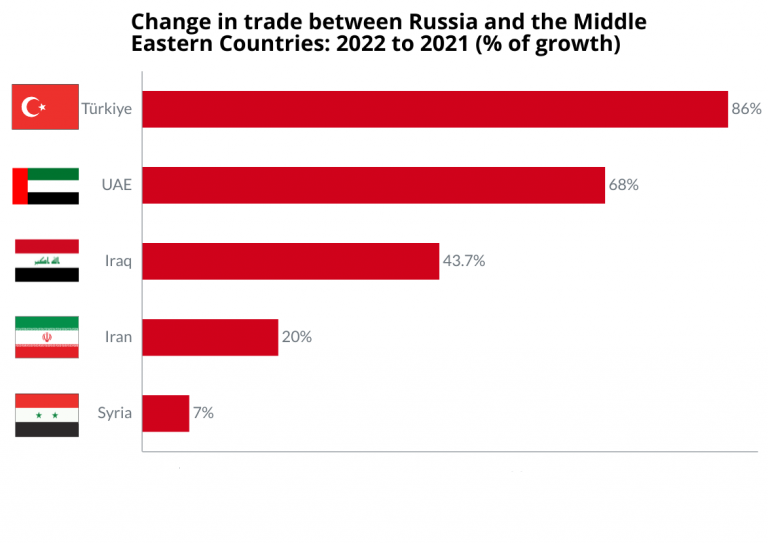
Sources: RBC (https://www.rbc.ru/economics/01/06/2021/60b612799a79472a8e22625d); Russian Trade (https://russian-trade.com/reports-and-reviews/2022-02/torgovlya-mezhdu-rossiey-i-kitaem-v-2021-g/); Rambler. Finance (https://finance.rambler.ru/economics/51393513-bezgranichnyy-biznes-s-kitaem-tormozit-na-tamozhne/) Figure 21. Trade between Russia and the Middle East Countries: 2022 to 2021 (percent of growth) (2023).
Sources: Compiled by PIR Center based on open sources.
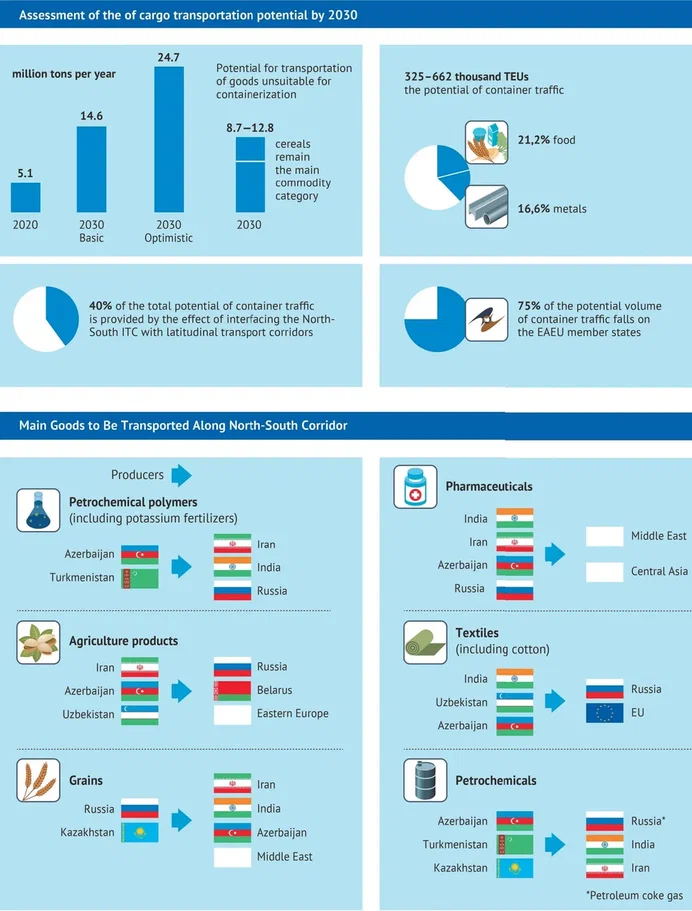
Sources: TASS (https://tass.ru/ekonomika/17094049); (https://tass.ru/ekonomika/19339659); RIA News (https://ria.ru/20221105/irak-1829327249.html); Interfax (https://www.interfax.ru/russia/881814); RIA News (https://ria.ru/20230315/tovarooborot-1858096182.html) Figure 22. International North-South Transport Corridor (2023).
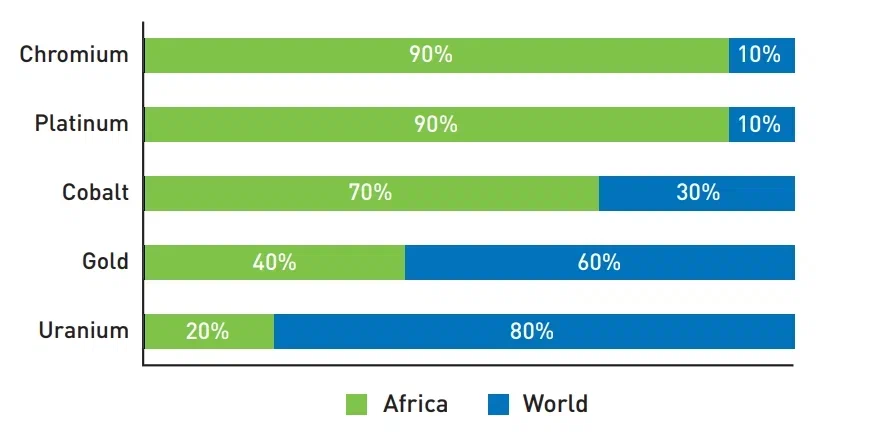
Source: Valdai Discussion Club (https://valdaiclub.com/multimedia/infographics/international-north-south-transport-corridor-/) Figure 23. Reserves of Natural Resources: Africa and the World (2023).
Sources: Compiled by PIR Center based on the United Nations.
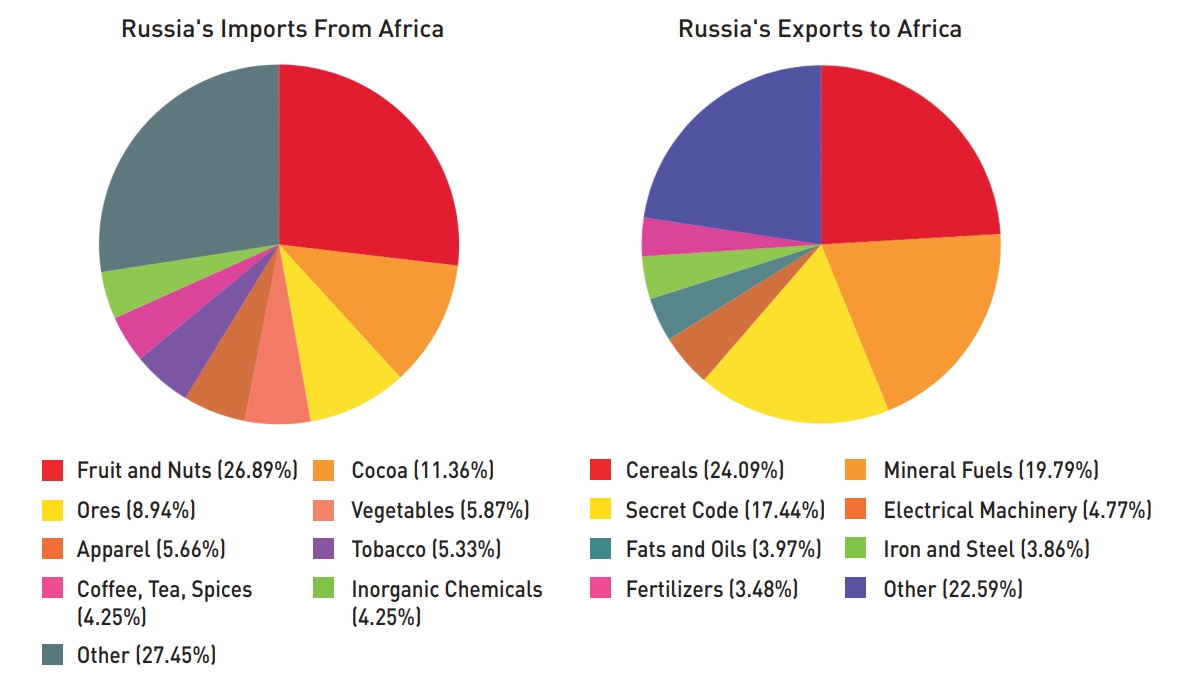
Source: UNEP (https://www.unep.org/regions/africa/our-work-africa#:~:text=The%20continent%20has%2040%20percent,internal%20renewable%20fresh%20water%20source) Figure 24. Trade between Russia and African Countries (as of March 2022).
Sources: Compiled by PIR Center based on the Federal Customs Service of Russia.
Source: Federal Customs Service of Russia (https://customs.gov.ru/press/federal/document/329649) Figure 25. Russia’s Export to Latin America (as of 2020).
Sources: Compiled by PIR Center based on BACI DATABASE.
Source: BACI DATABASE (http://www.cepii.fr/CEPII/en/bdd_modele/bdd_modele_item.asp ?id=37) Figure 26. Number of Warheads in the Arsenals of the US and Russia (2023).