-
About PIR Center
-
Projects
-
Research and Applied Analysis: Ongoing Projects
- PIR Center’s list of active projects 2025-2026
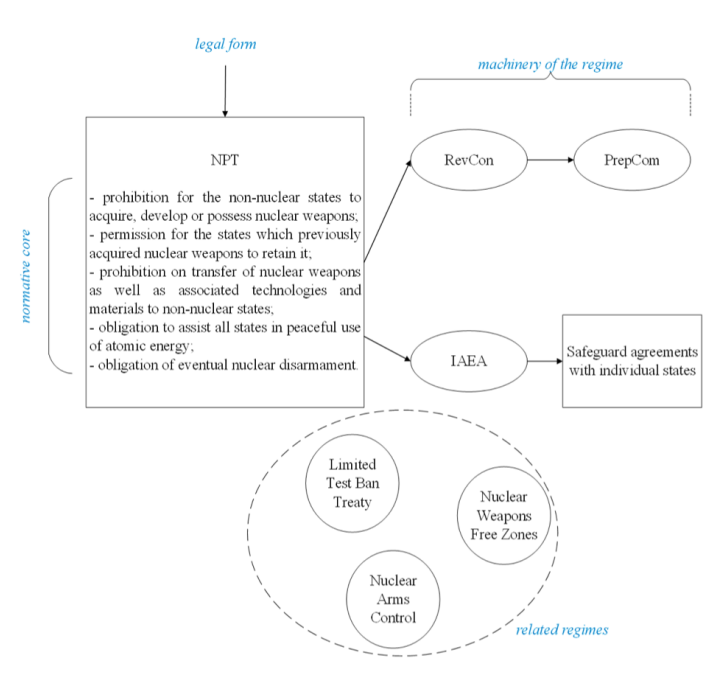
- Future of the NPT & Russia’s Interests
- Assessing Nuclear Proliferation Threats in the World: Who the Emerging Actors Are
- Strategic Stability and Arms Control in the Second Quarter of the 21st Century: Evolving Frameworks
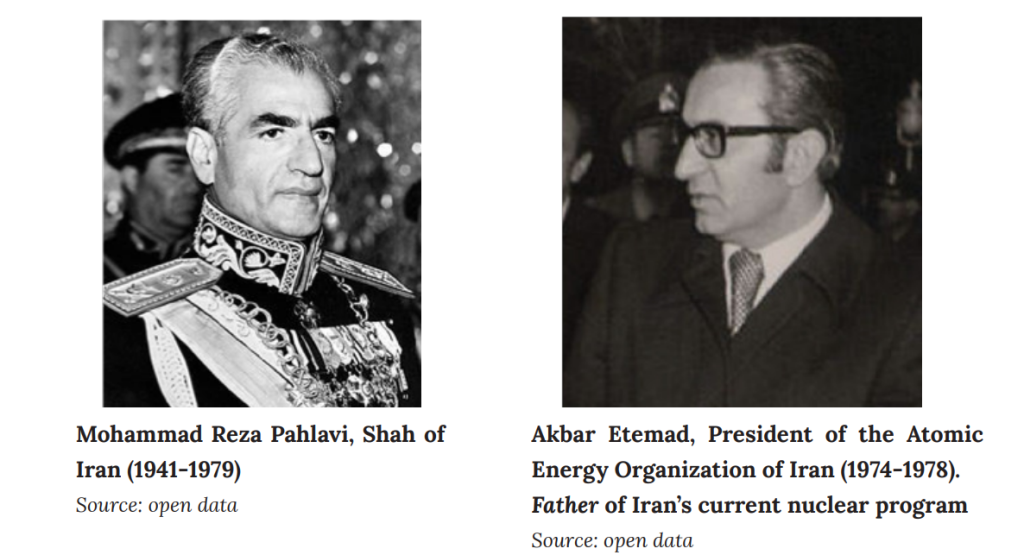
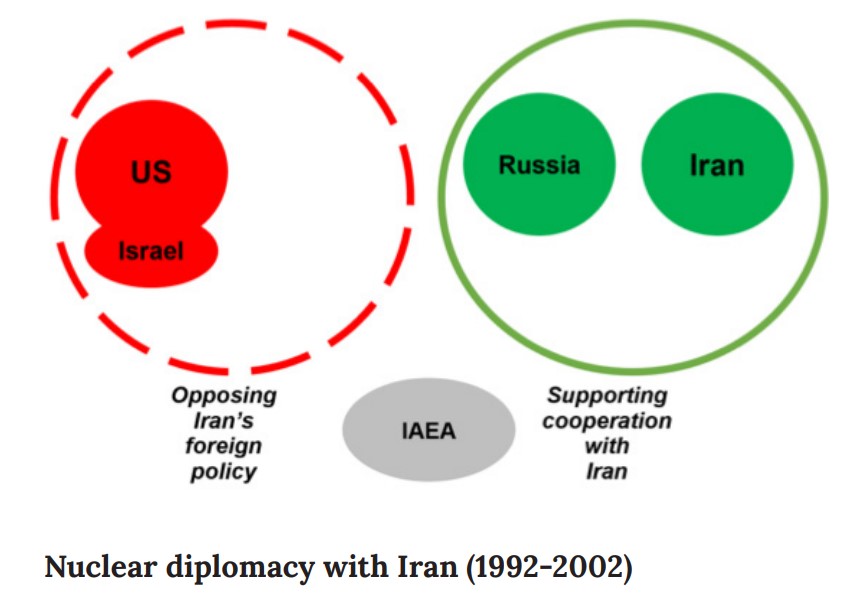
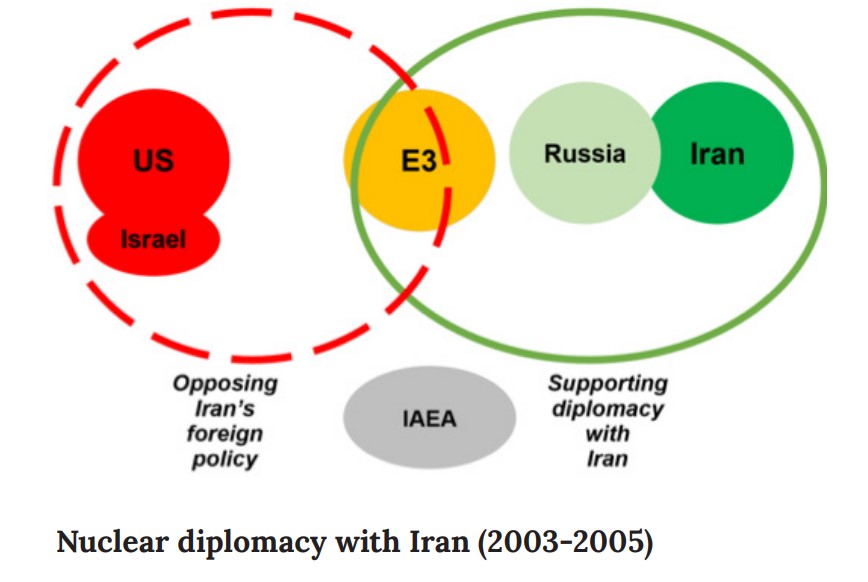
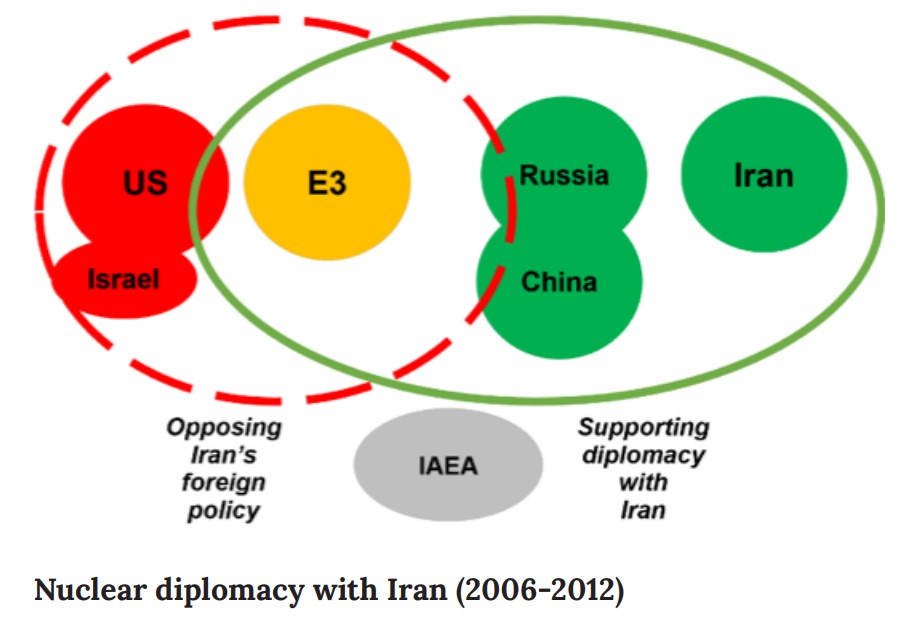
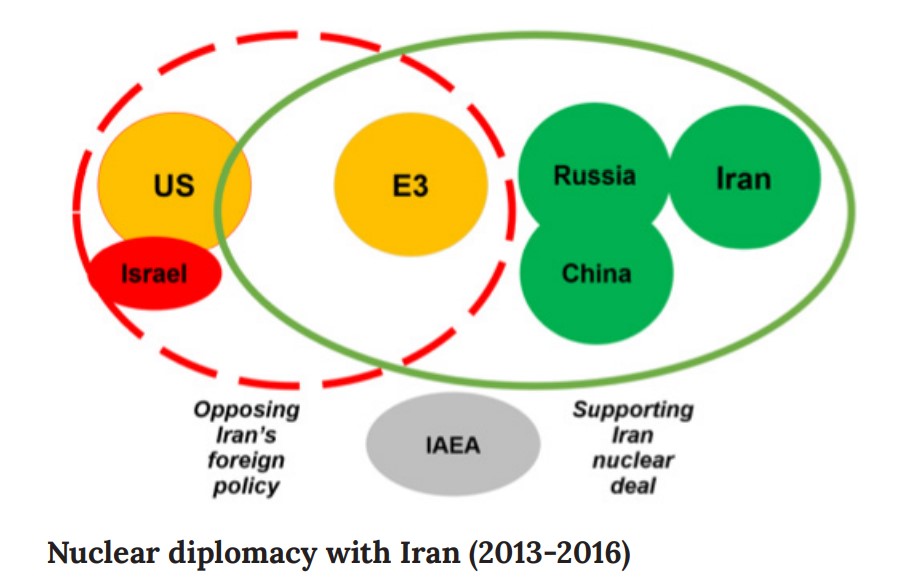
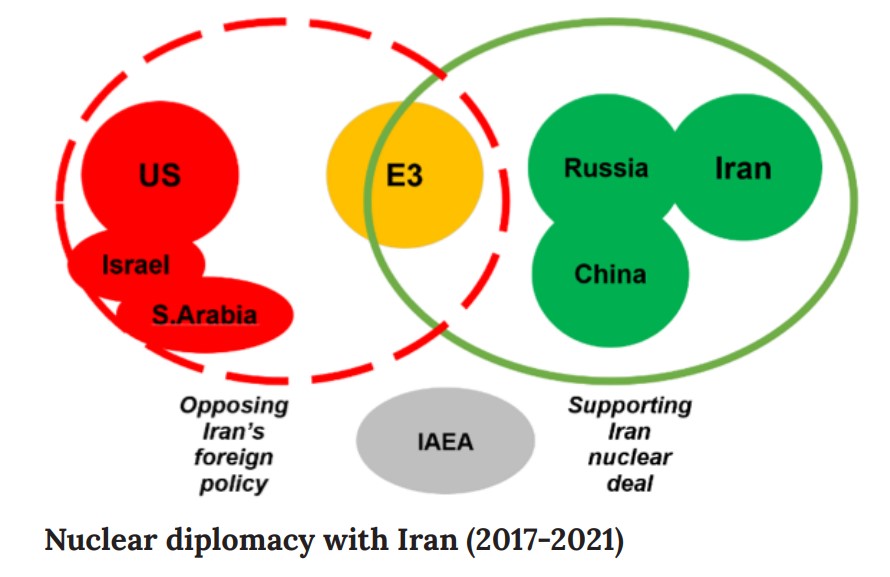
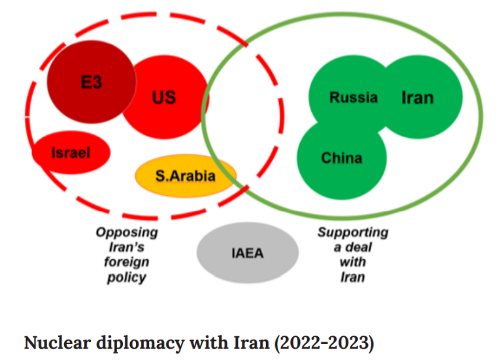
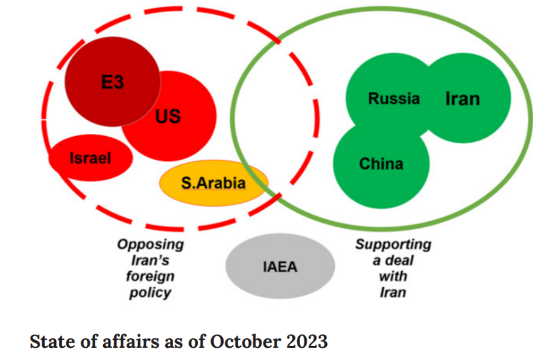
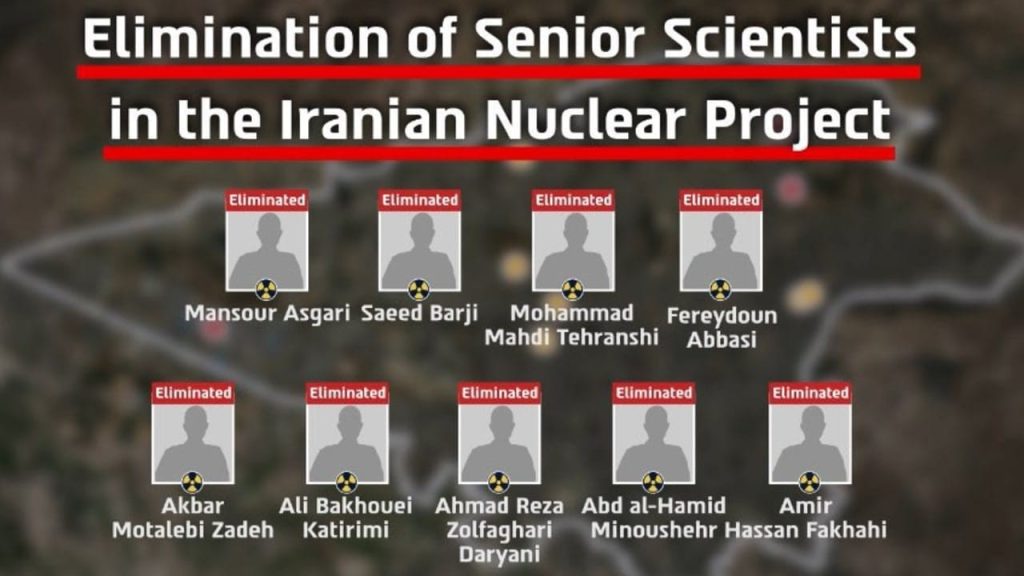
- Iranian Nuclear Program: Russia’s Interests
- Assessing Prospects for Establishing WMD-Free Zone in the Middle East
- Global Security: New Ideas for Russian Foreign Policy
- Prospects for Cooperation between Russia and the Gulf States on Global Security and High Technologies
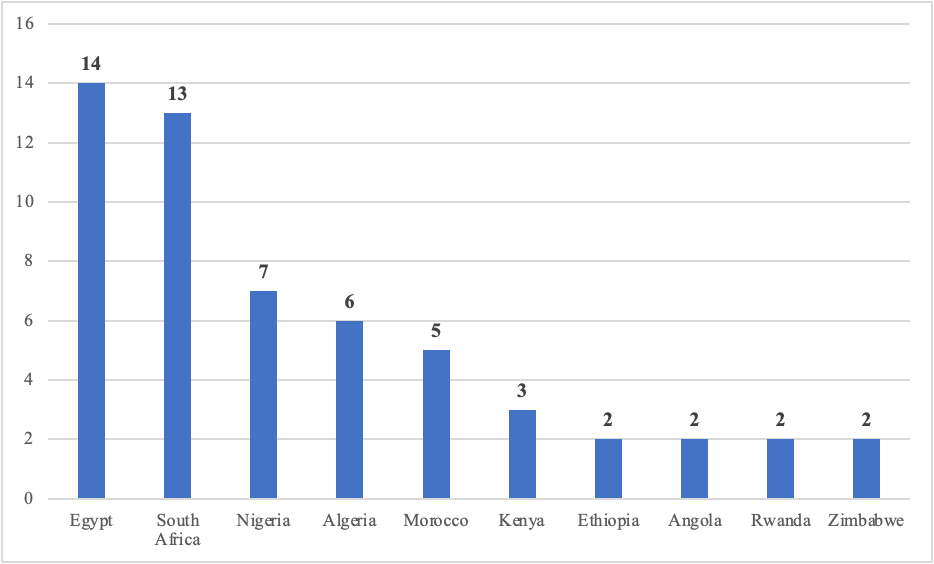
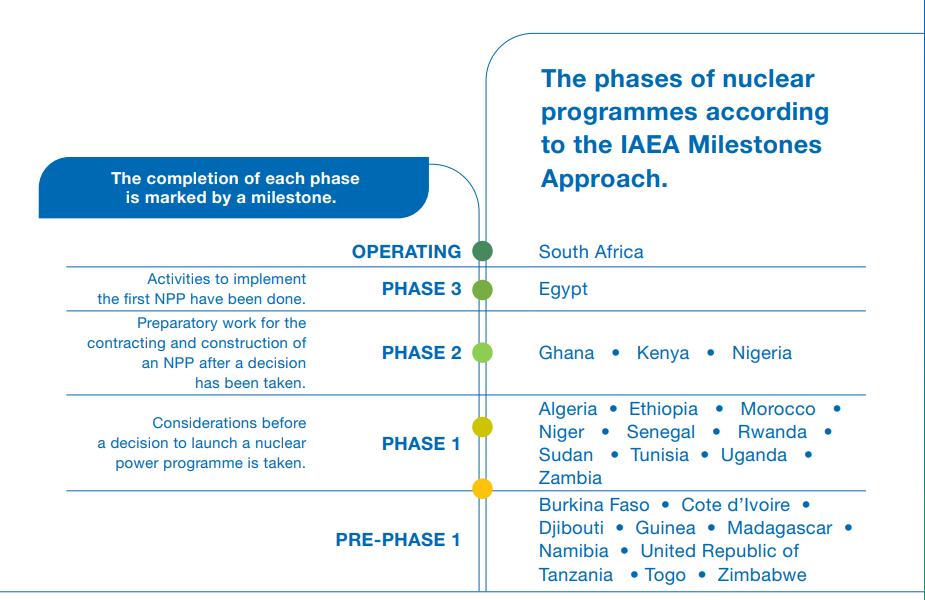
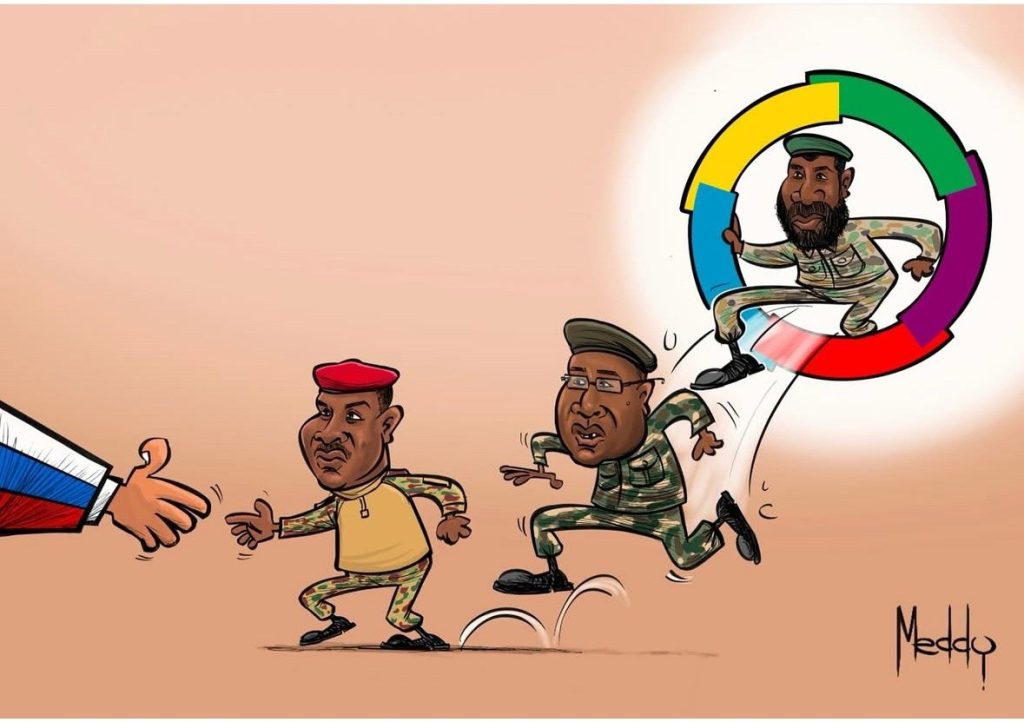
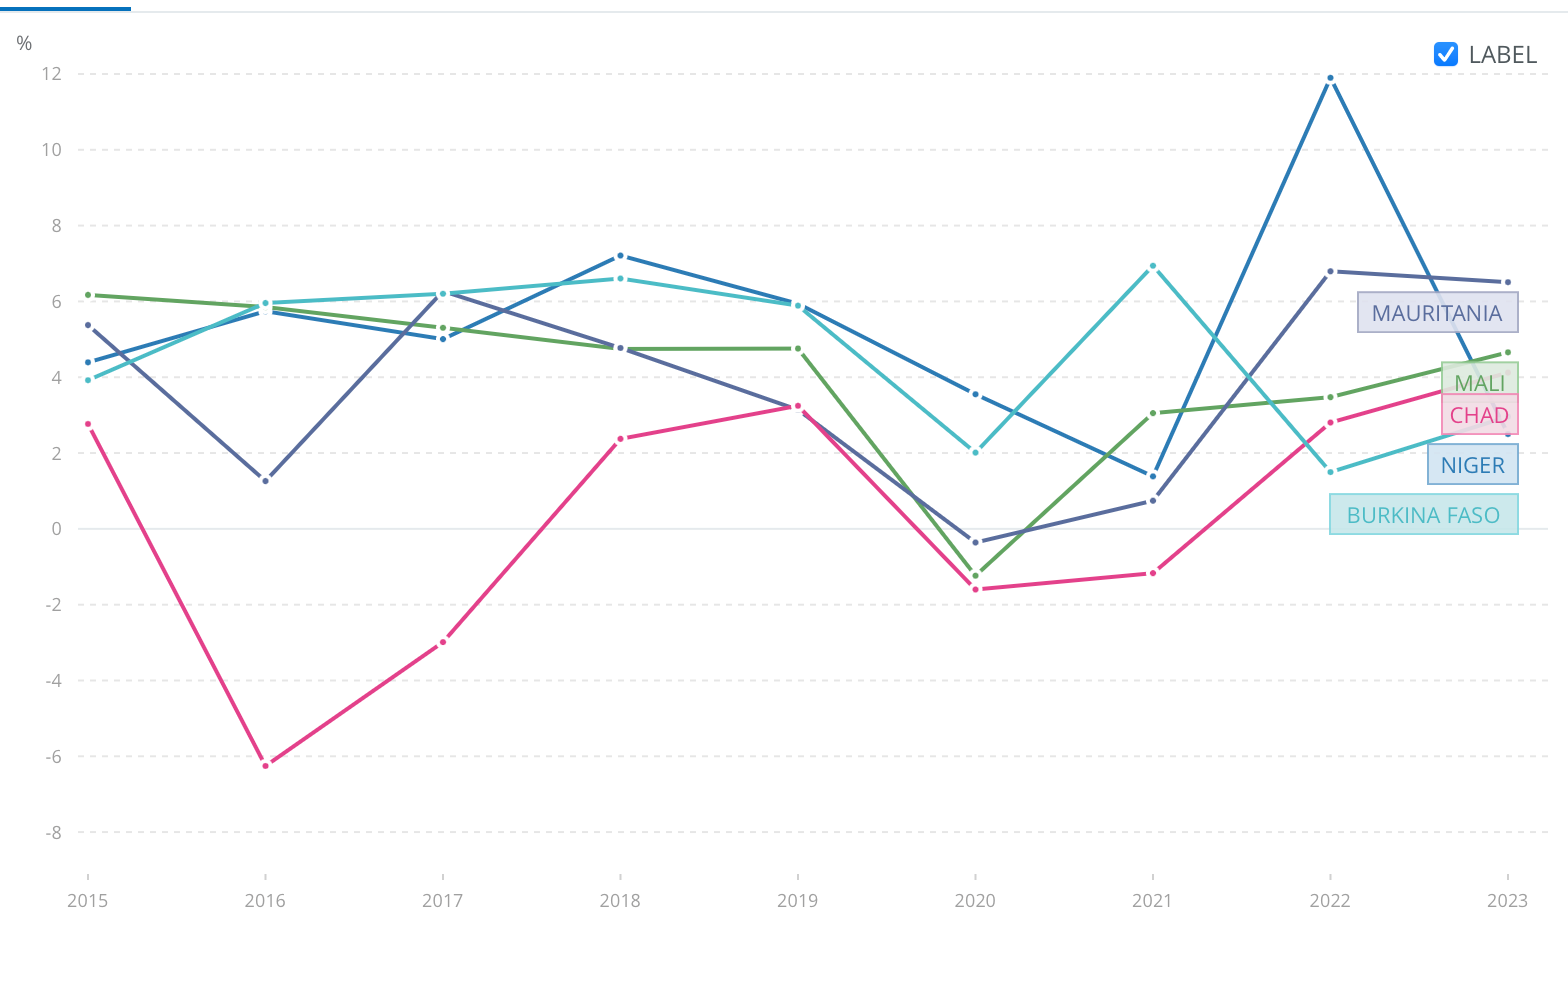
- Prospects for Cooperation between Russia and Africa on Global Security and High Technologies
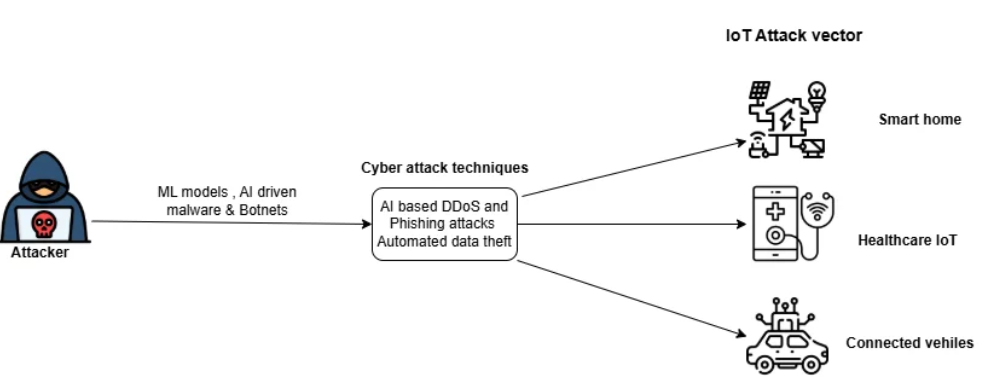
- International Information Security, Cyber Threats, and Impact of Emerging Technologies
- BRICS and Global Security
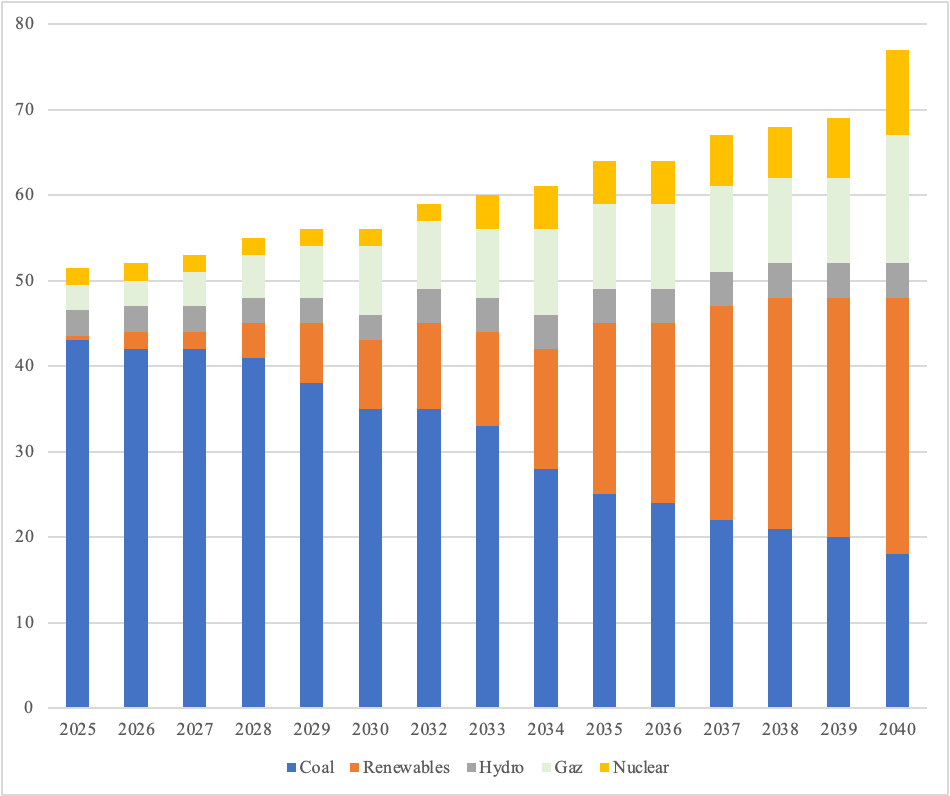
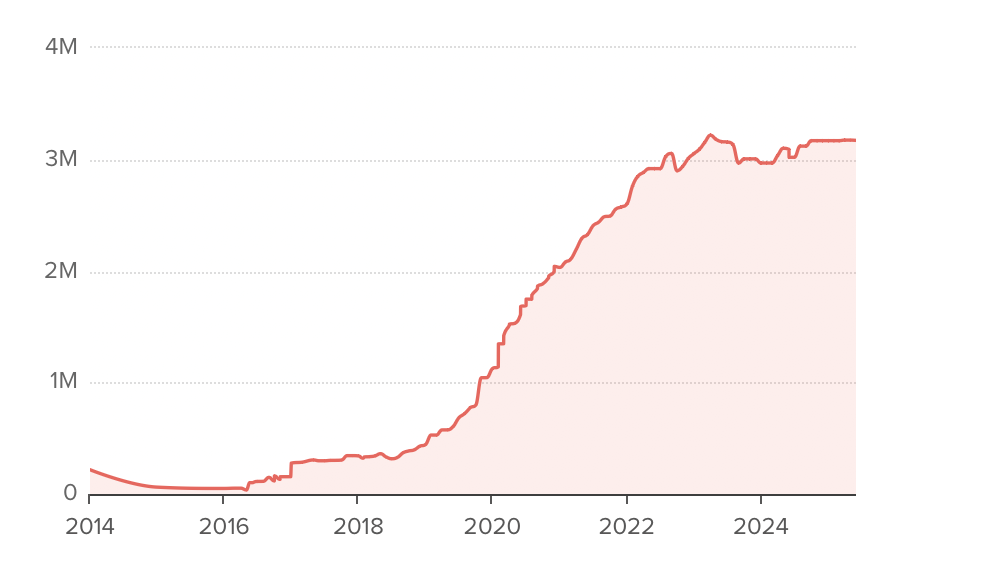
- Uranium Markets of Sahel: Competition, Strategies, Further Developments
-
Program Archive
- Global Internet Governance and International Information Security Program
- Perspectives for Russia-ASEAN cooperation in strategic spheres
- Cybersecurity of Critical Nuclear Infrastructure
- Security in Central Asia and Russia
- Global Internet Governance and International Information Security
- International Security Index iSi
- Sustainable Partnership with Russia Group
- Arms control and ways toward nuclear disarmament
- The Future of the Global Partnership Program and Russia-US Cooperation in Nuclear Security
- Reform of the Russian Armed Forces: Assessing the Developments
- Prospects for the Arms Trade Treaty
- Russia-Ukraine: Shaping Common Views on European Security Architecture
- Rebuilding the Russian-American Dialogue on Global Security
- Towards a New European Security Agenda
-
Research and Applied Analysis: Ongoing Projects
- Security Index Yearbook
-
Education
- About Education & Training Program
- International School on Global Security
- International Dual Degree M.A. Program
- Internship Program
- Cooperation with Universities
- Midweek Brainstorming Sessions
- The International Timerbaev Nuclear Debates & Amb. Timerbaev's Scientific Archive
- Ten-Year Global Plan on Promoting Disarmament and Nonproliferation Education: 2018-2027
- Archived projects
-
Publications
-
Nonproliferation.World
-
PIR Community
- Support us